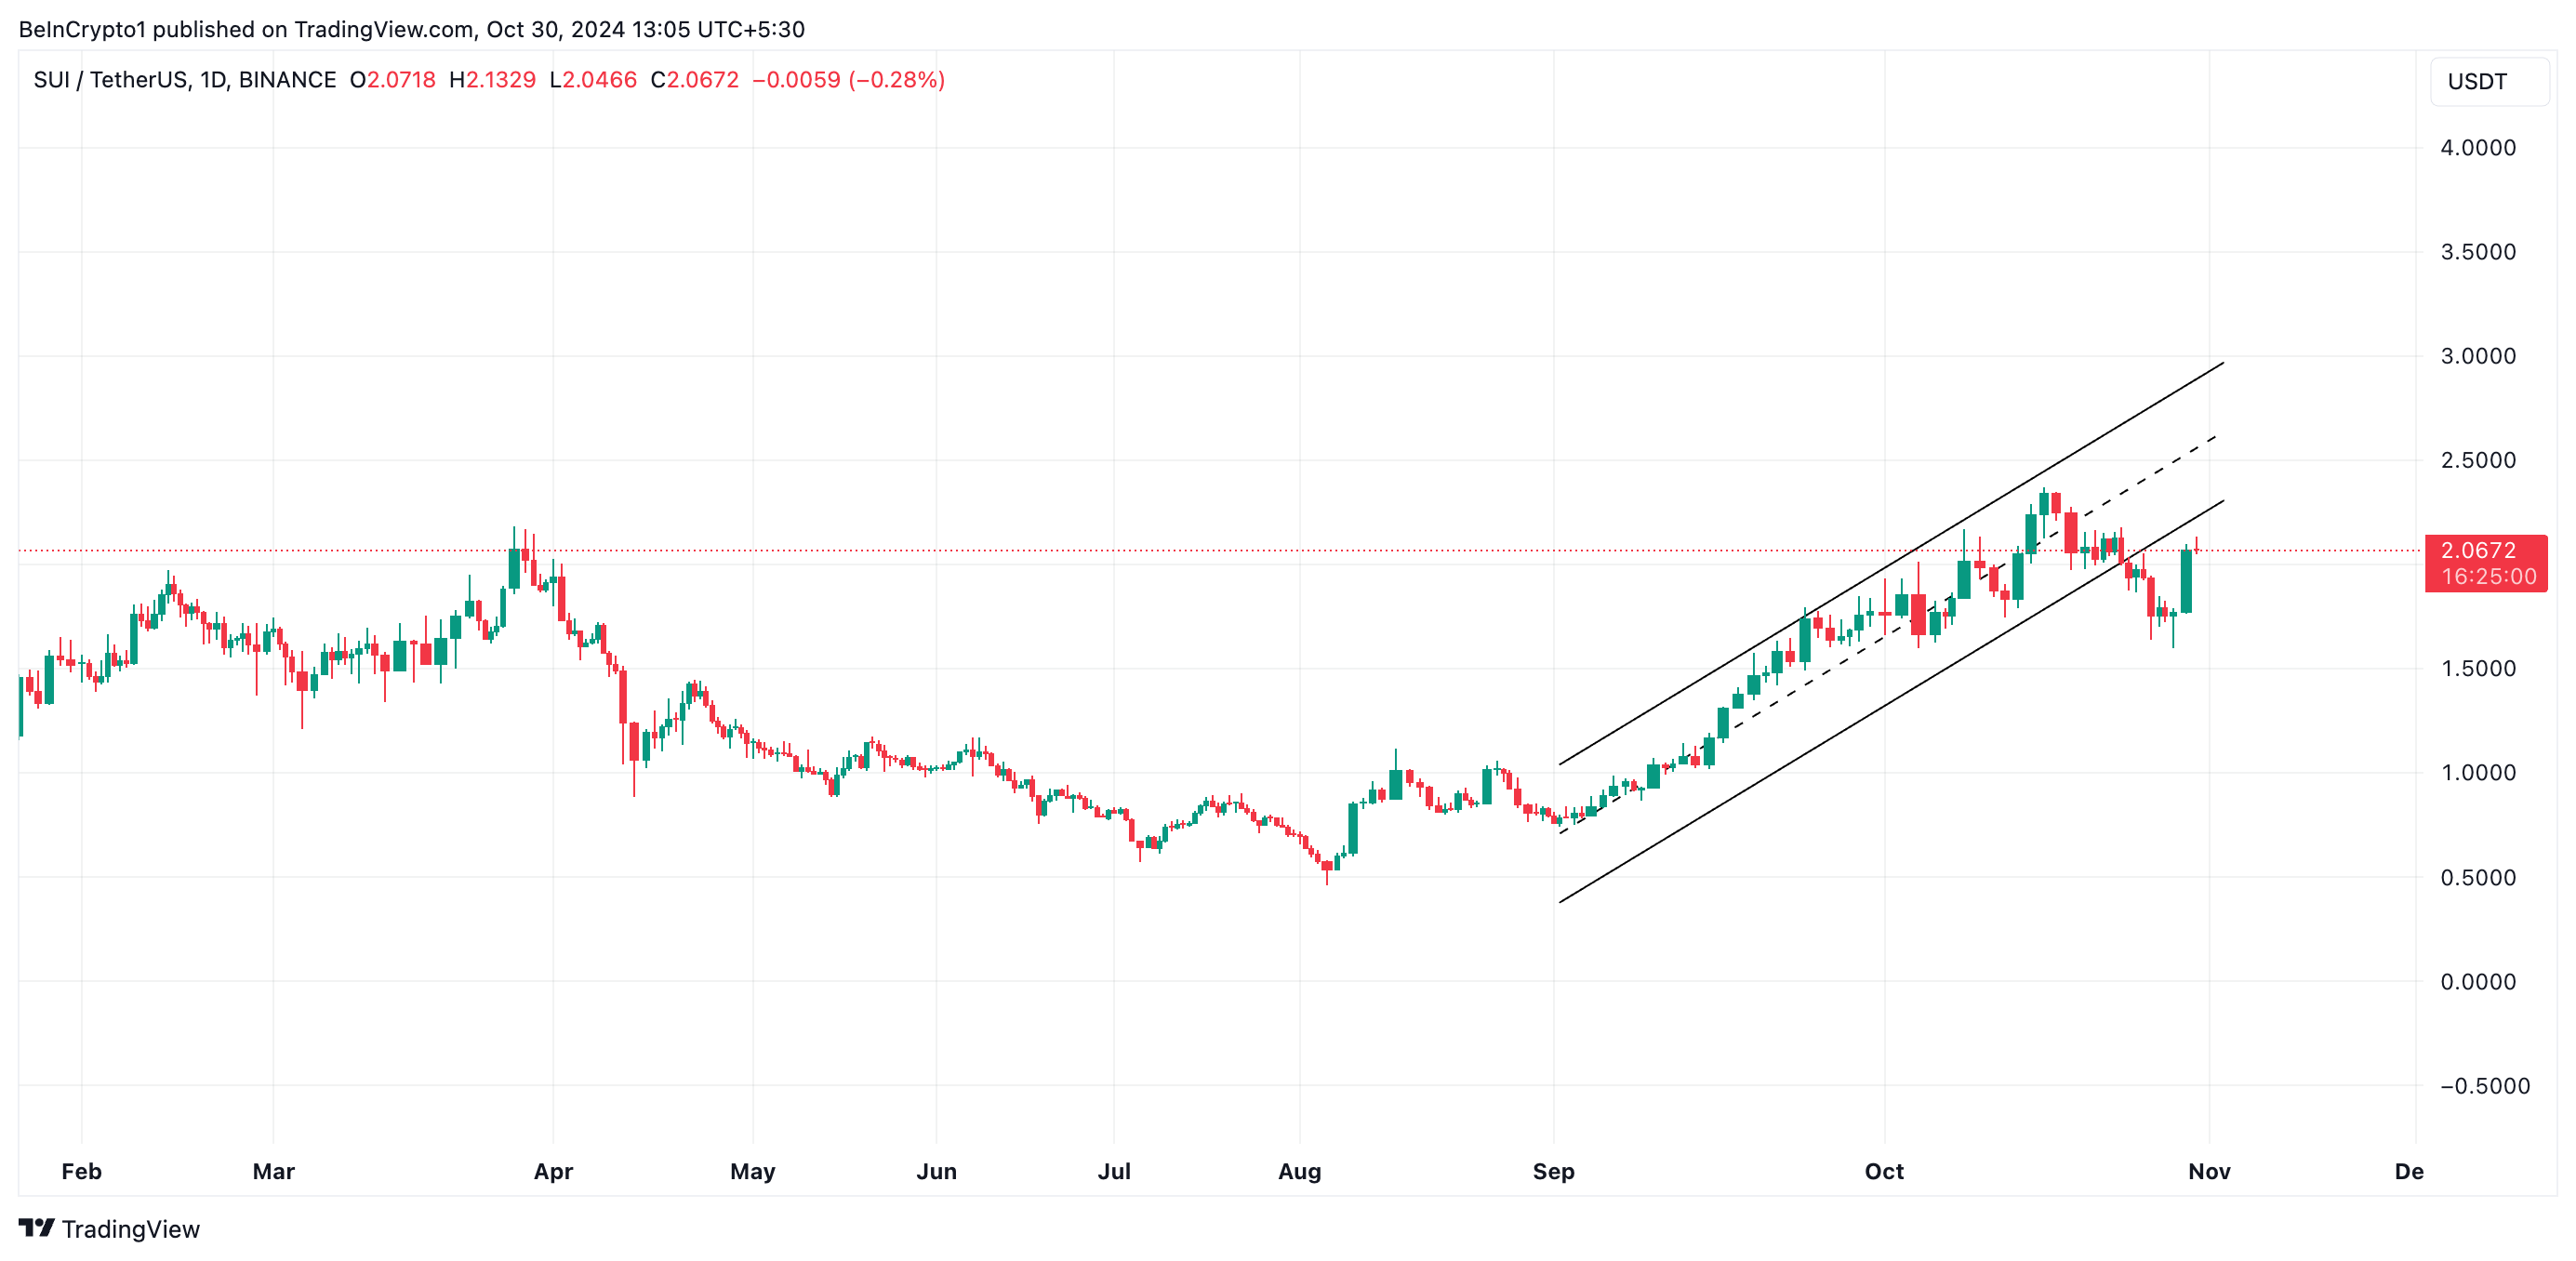
The SUI/USD 1-day chart shows the altcoin attempting to re-enter its rising parallel pattern, which broke below on October 22. This channel is a bullish pattern generated when an asset’s price moves between two parallel trendlines that slant higher.
Currently trading at $2.06, the altcoin is poised to prolong its double-digit gains.
SUI Bulls Effort for Takeover
When an asset’s price falls below a certain level and then attempts to re-enter it, it usually indicates a potential trend reversal or recovery. SUI’s possible re-entry into the channel indicates renewed purchasing interest, implying that the earlier breakout could have been a bear trap.

A bear trap occurs when the price of an asset briefly goes below a trendline or channel, implying that the downtrend will continue but then quickly reverse and rise, catching sellers who predict a further decline.
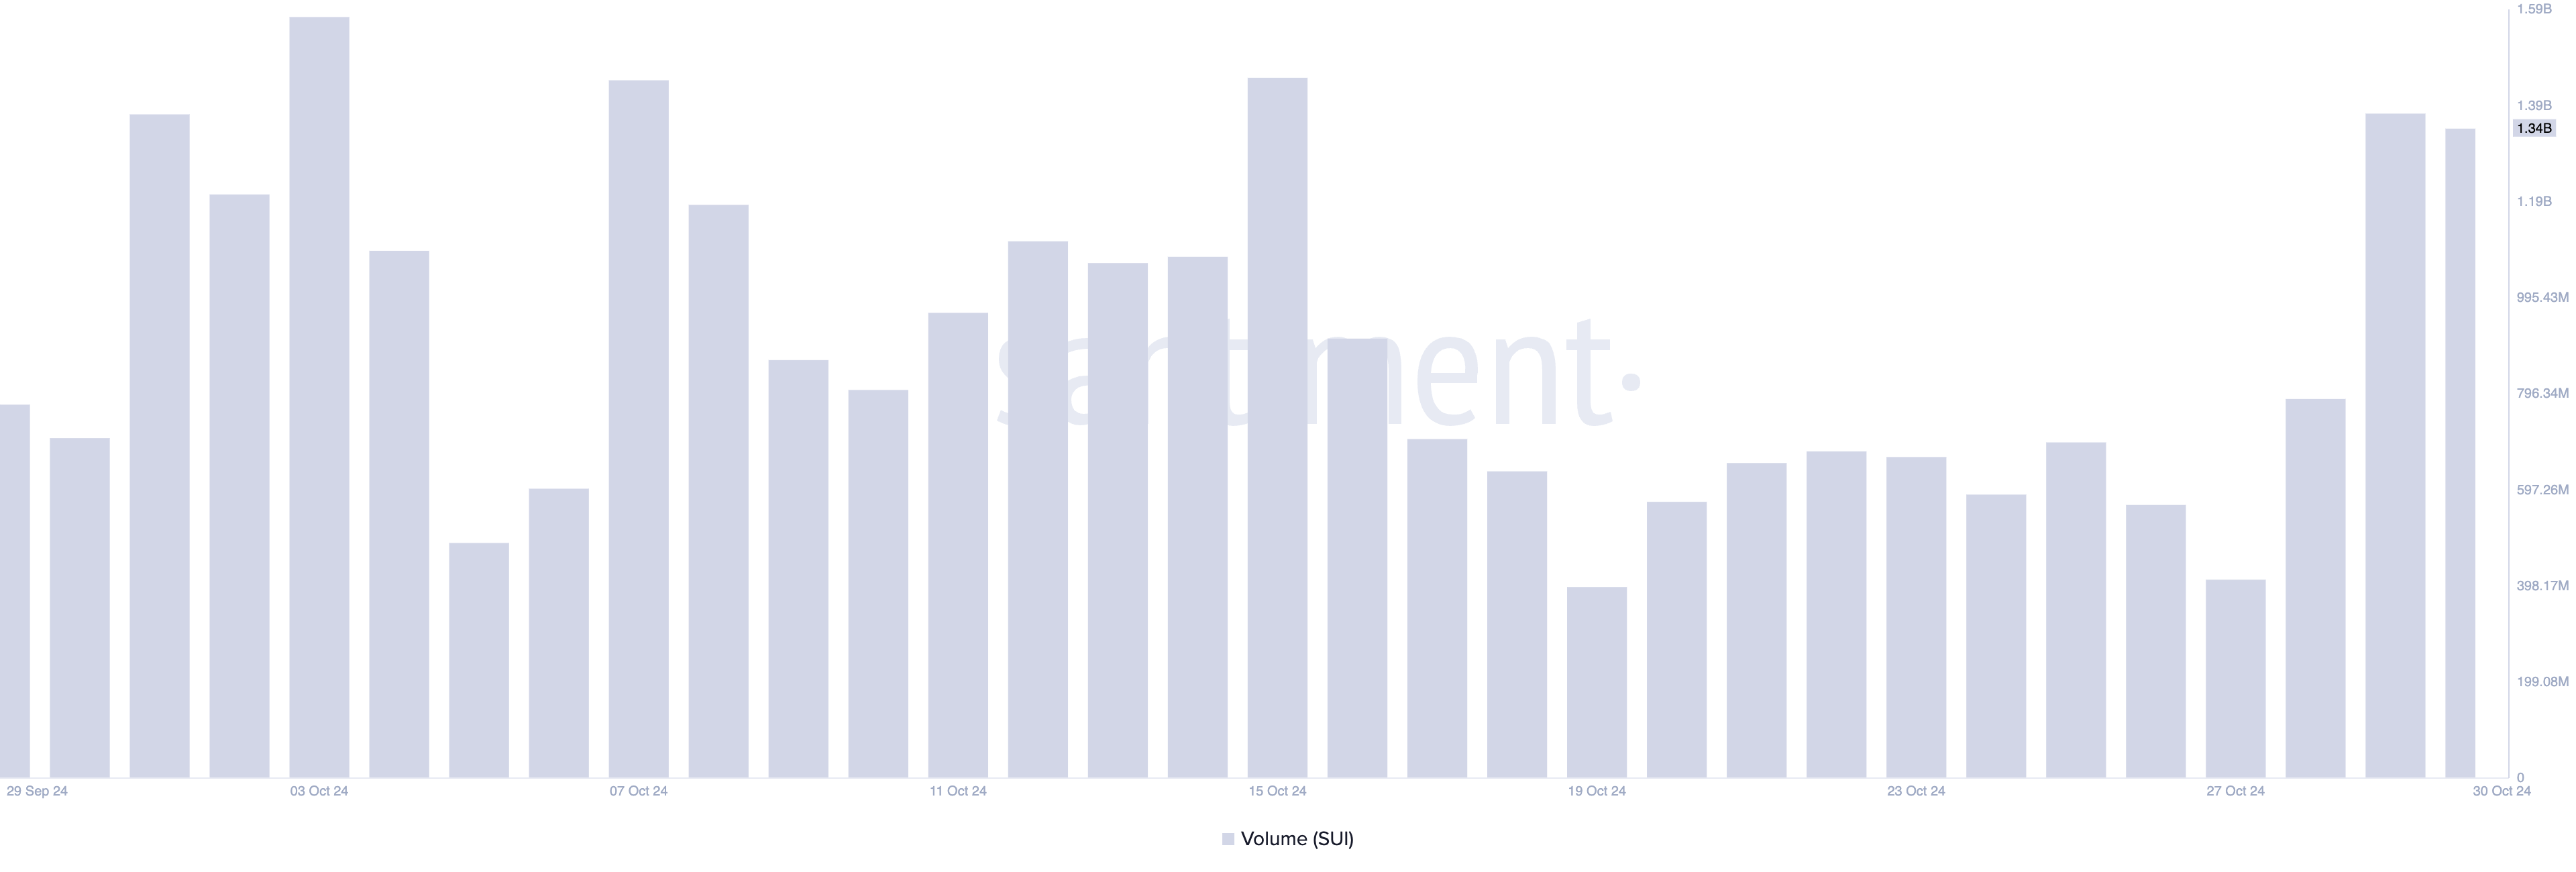
A bear trap, sometimes accompanied by a volume increase on the reversal, signals considerable buying activity below. This is the case with SUI, as trade volume has increased by 39% in the last 24 hours, reaching $1.34 billion.

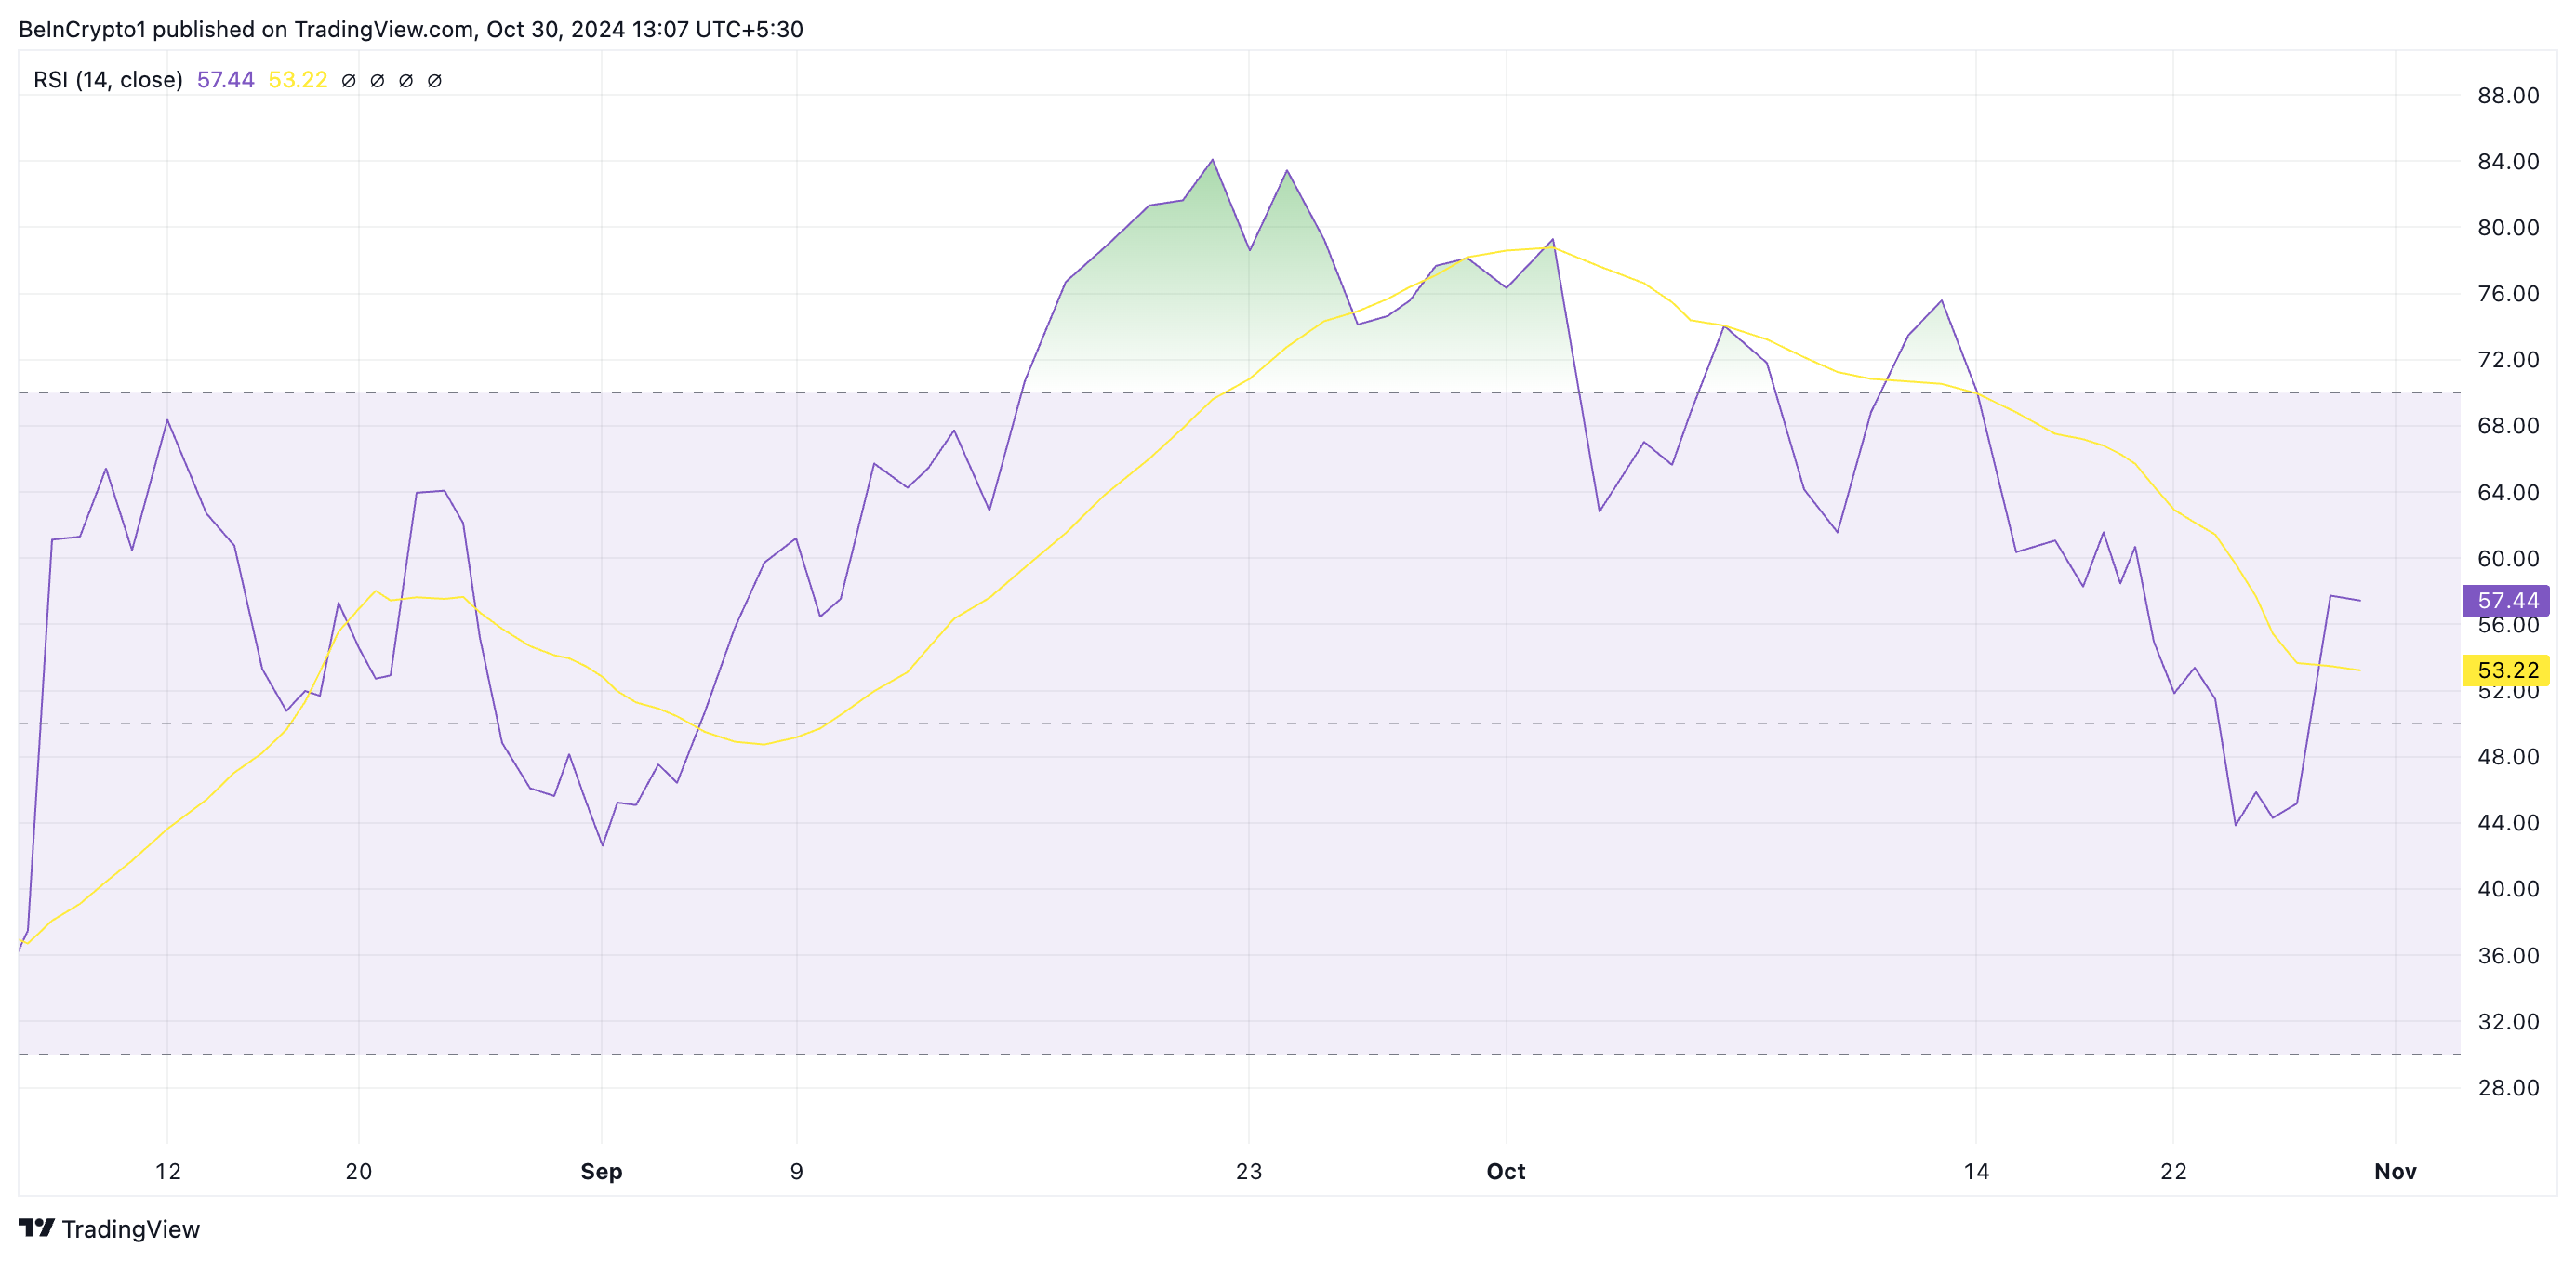
SUI’s rising Relative Strength Index (RSI) reflects the return of demand. This indicator, currently heading upward at 57.44, indicates that buying momentum is gaining traction and has surpassed sales activity.


